Connect
Organise the analysis around executive business questions.
↗INDEPENDENT PROJECT / TABLEAU / GITHUB / 04
Six Tableau views of profit, discounting, customers, markets and seasonality.
EXPLORE THE STORY ↓Four years of reported analysis coverage.
THE BUSINESS PROBLEM
Give decision-makers a connected view of where value is created, concentrated or lost.
 OPEN FULL SIZE ↗
WHAT I DID
Organise the analysis around executive business questions.
↗Explore losses, discounts and customer concentration.
↗Link market contribution and seasonality in six Tableau views.
↗THE RESULTS
The deliverable helps readers investigate profitability beyond the sales total. Discount–loss patterns remain associations.
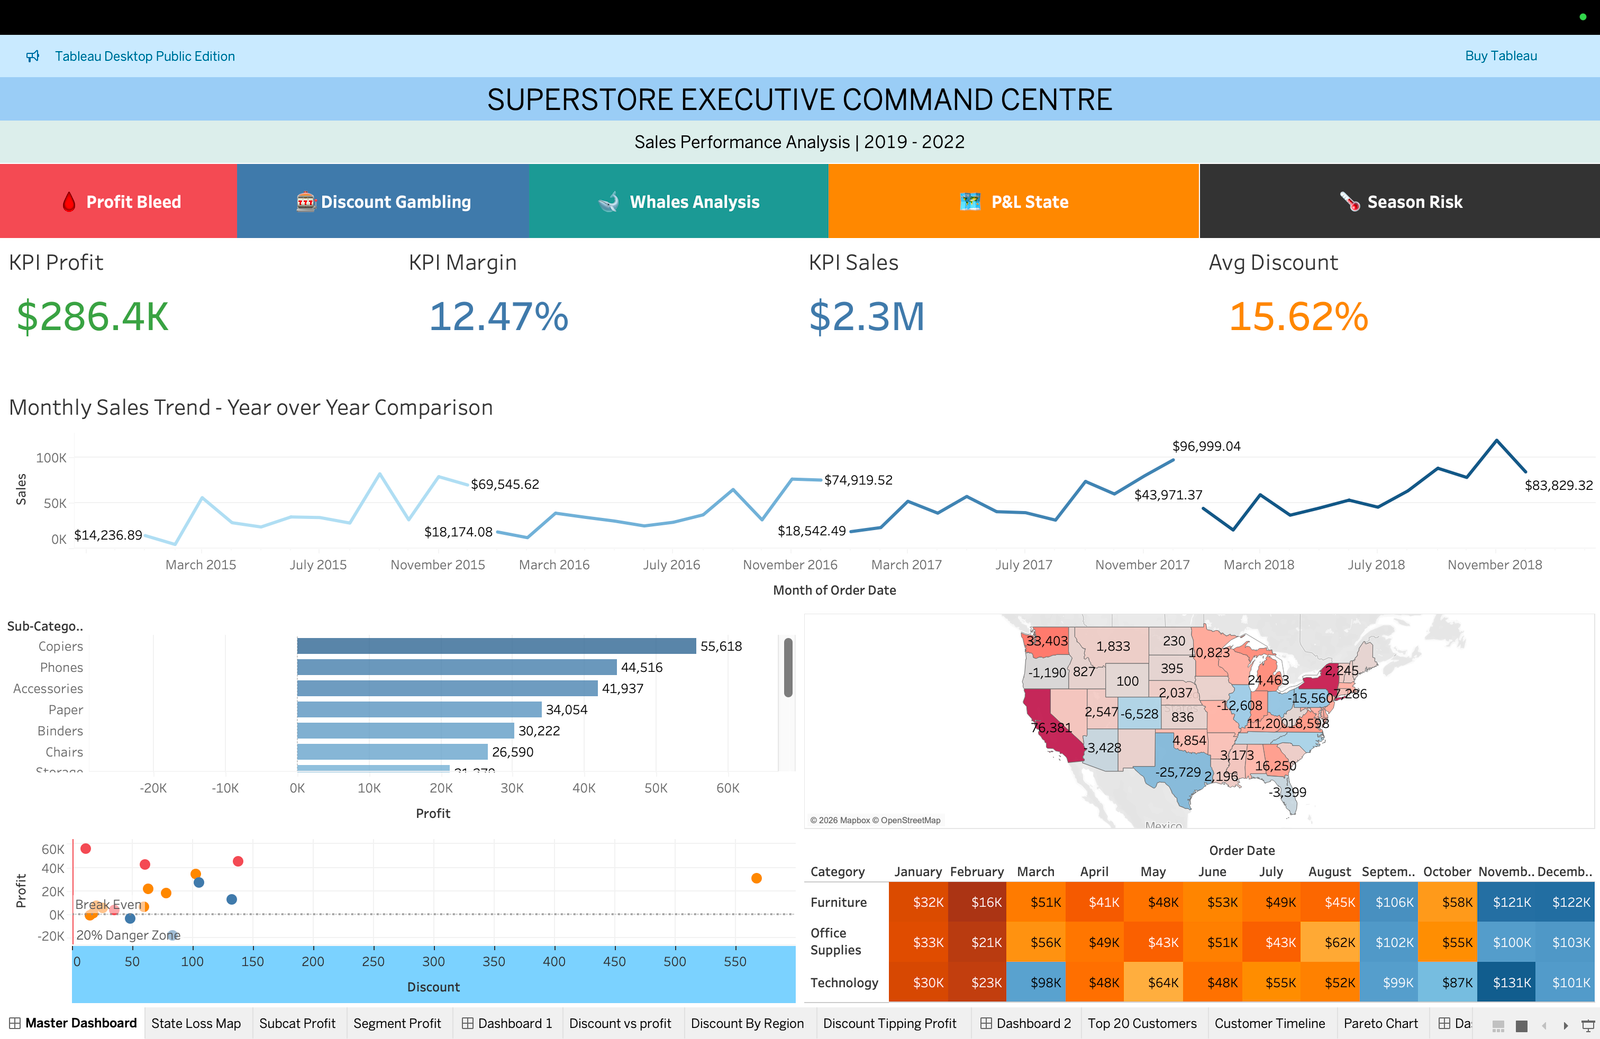
Performance at a glance.
Where profit falls away.
The relationship with losses.
Value and concentration.
Geographic contribution.
Exposure across the year.
Review discount and loss patterns in context before changing commercial policy.
↗THE EVIDENCE / GO DEEPER
LET’S DISCUSS YOUR PROJECT ↗Where do strong sales mask poor profitability? How do discount patterns relate to losses? Which customers and markets contribute value, and how concentrated is demand in Q4?
The repository presents an executive overview, loss-source analysis, discount investigation, customer concentration, state-level P&L, and seasonality views. Together they show why revenue alone is an incomplete measure of performance.
Discount and loss patterns are associations in the analysed sample, not proof that a discount guarantees a loss. The case study links to the dashboard PDF and repository so the analysis can be reviewed in context.
Source: public GitHub repository README and dashboard artifact. Self-initiated analysis of Sample Superstore data; no client relationship implied.
YOUR NEXT MOVE