Prepare
Audit 31.8M rows, join product data and remove partial modelling months.
↗RESEARCH / PYTHON + POWER BI / 2026 / 01
Customer value. Demand patterns. A forecast tested against a baseline.
EXPLORE THE STORY ↓Champions
Other segments
Share of normalised sales value.
THE BUSINESS PROBLEM
Turn transaction history into customer priorities and a defensible planning baseline.
23 complete months · normalised sales value, not currency.
| Month | Normalised value |
|---|---|
| 2018-10 | 41,584.82 |
| 2018-11 | 39,000.99 |
| 2018-12 | 32,532.51 |
| 2019-01 | 33,449.98 |
| 2019-02 | 31,428.22 |
| 2019-03 | 37,549.02 |
| 2019-04 | 42,824.99 |
| 2019-05 | 43,357.50 |
| 2019-06 | 48,648.42 |
| 2019-07 | 40,387.13 |
| 2019-08 | 30,545.85 |
| 2019-09 | 40,304.05 |
| 2019-10 | 36,987.71 |
| 2019-11 | 38,854.42 |
| 2019-12 | 31,267.59 |
| 2020-01 | 28,793.58 |
| 2020-02 | 28,792.88 |
| 2020-03 | 30,274.21 |
| 2020-04 | 37,808.48 |
| 2020-05 | 37,145.69 |
| 2020-06 | 43,055.36 |
| 2020-07 | 32,363.01 |
| 2020-08 | 33,130.50 |
WHAT I DID
Audit 31.8M rows, join product data and remove partial modelling months.
↗Build RFM scores using distinct purchase dates for frequency.
↗Test forecast models against a seasonal naive baseline.
↗THE RESULTS
Champions contribute 68.9% of sales value. Monthly SARIMA reduces held-out forecast error from 15.6% to 8.2%.
MAPE on the same monthly holdout. Research result; no commercial uplift claimed.
Test retention initiatives for high-value customers. Compare future forecasts using the same evaluation protocol.
↗THE EVIDENCE / GO DEEPER
LET’S DISCUSS YOUR PROJECT ↗Which customer groups contribute most value? How does demand vary over time? Does a more complex forecasting model outperform a simple baseline?
Processed 31,788,324 transaction rows from September 2018 to September 2020, joined product metadata, audited missingness and repeated rows, and built RFM scores. Frequency used distinct purchase dates rather than transaction-line counts. Partial first and final months were removed from the monthly modelling series.
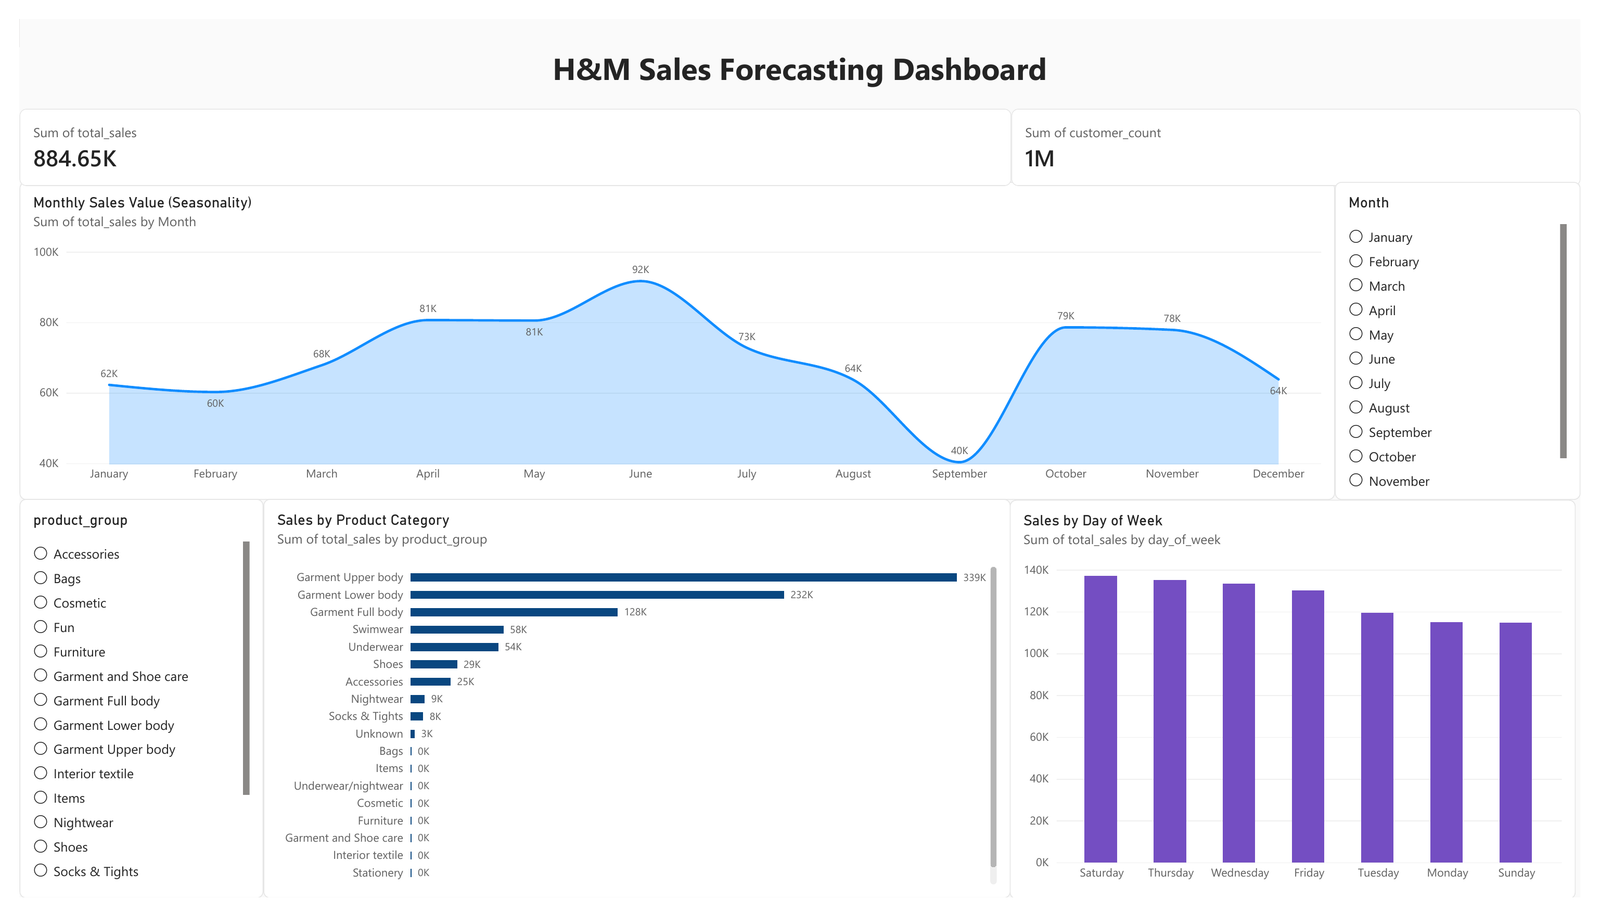
Champions represented around 23% of customers and contributed 68.9% of normalised sales value. Champions and Loyal customers together contributed approximately 88%. This supports testing targeted retention approaches; it does not establish that retention outperforms acquisition.
Monthly SARIMA achieved 8.2% MAPE versus 15.6% for the seasonal naive baseline. Weekly linear regression achieved 7.5% under rolling one-step-ahead evaluation. More complex models did not automatically improve performance.
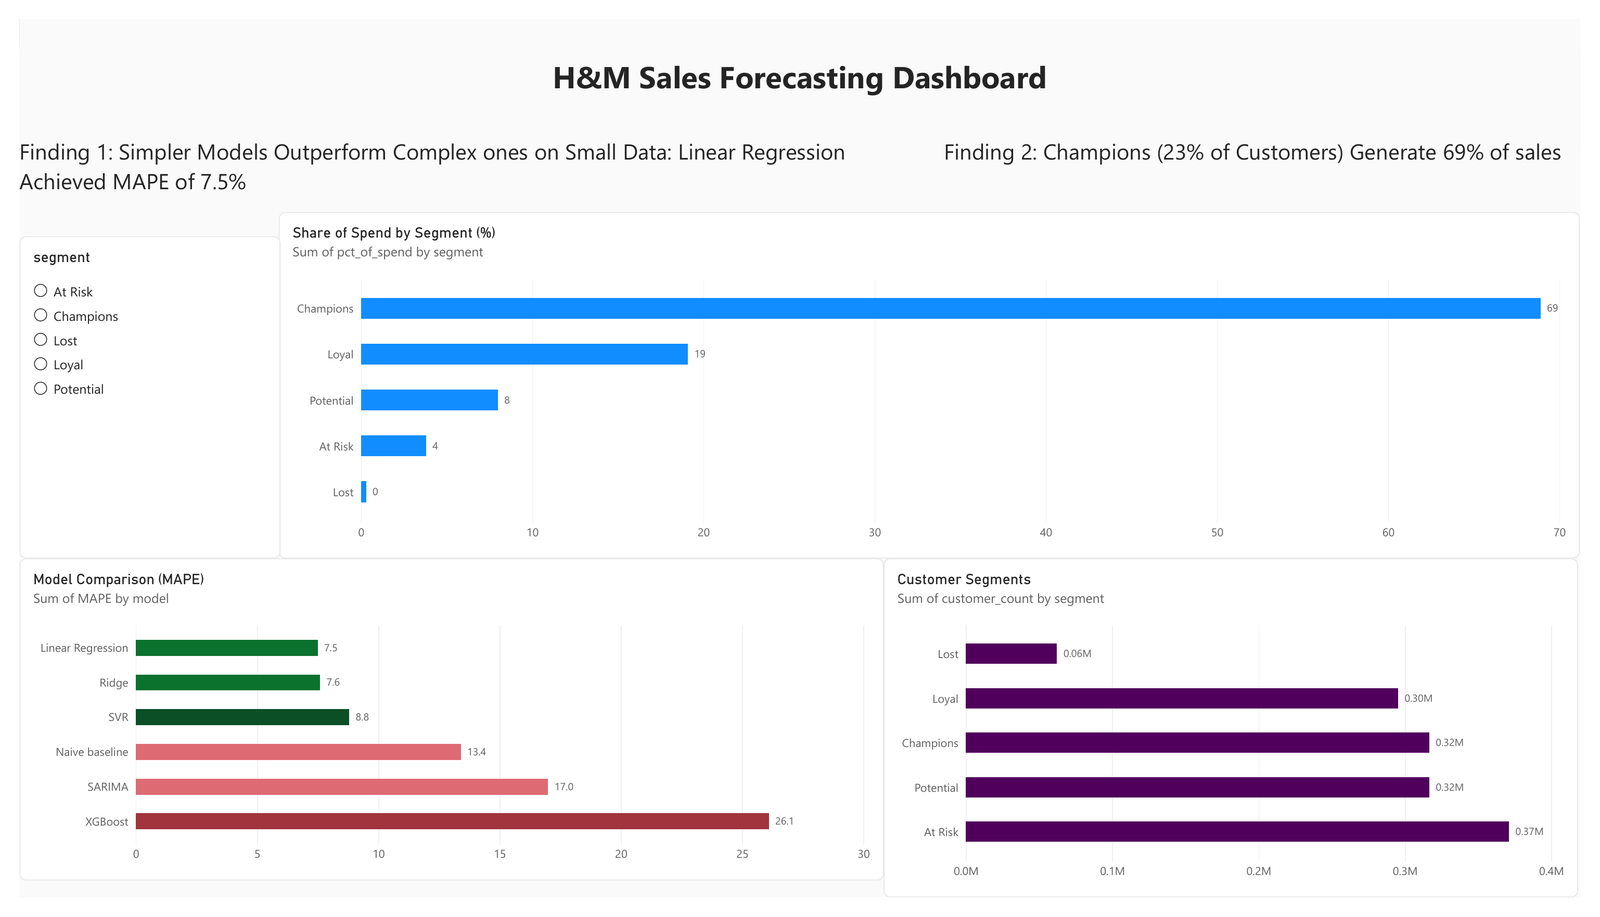
H&M prices are normalised values, not currency revenue. Weekly feature models used observed lagged values; weekly SARIMA forecast multiple steps from a fixed endpoint, so those results are not perfectly like-for-like. The RFM feature experiment used full-history segments and same-week shares: it is exploratory and did not improve forecasts. A stricter follow-up would use rolling cutoffs and lagged segment features.
Prioritise retention experiments for high-value customers, compare forecasts using a common walk-forward protocol, and collect longer history before relying on long-range forecasts. The research gives decision support, not a claim of deployed commercial uplift.
Source: executed research notebooks and Power BI outputs from the September 2026 dissertation. Research using the public H&M dataset, rather than a commercial engagement with H&M.
YOUR NEXT MOVE